The idea, in one minute
An index can keep rising while fewer stocks take part.
Market breadth measures that. I use the percentage of stocks trading above their 200-day moving average, on a weekly chart, next to the S&P 500. On TradingView the symbol is MMTH.
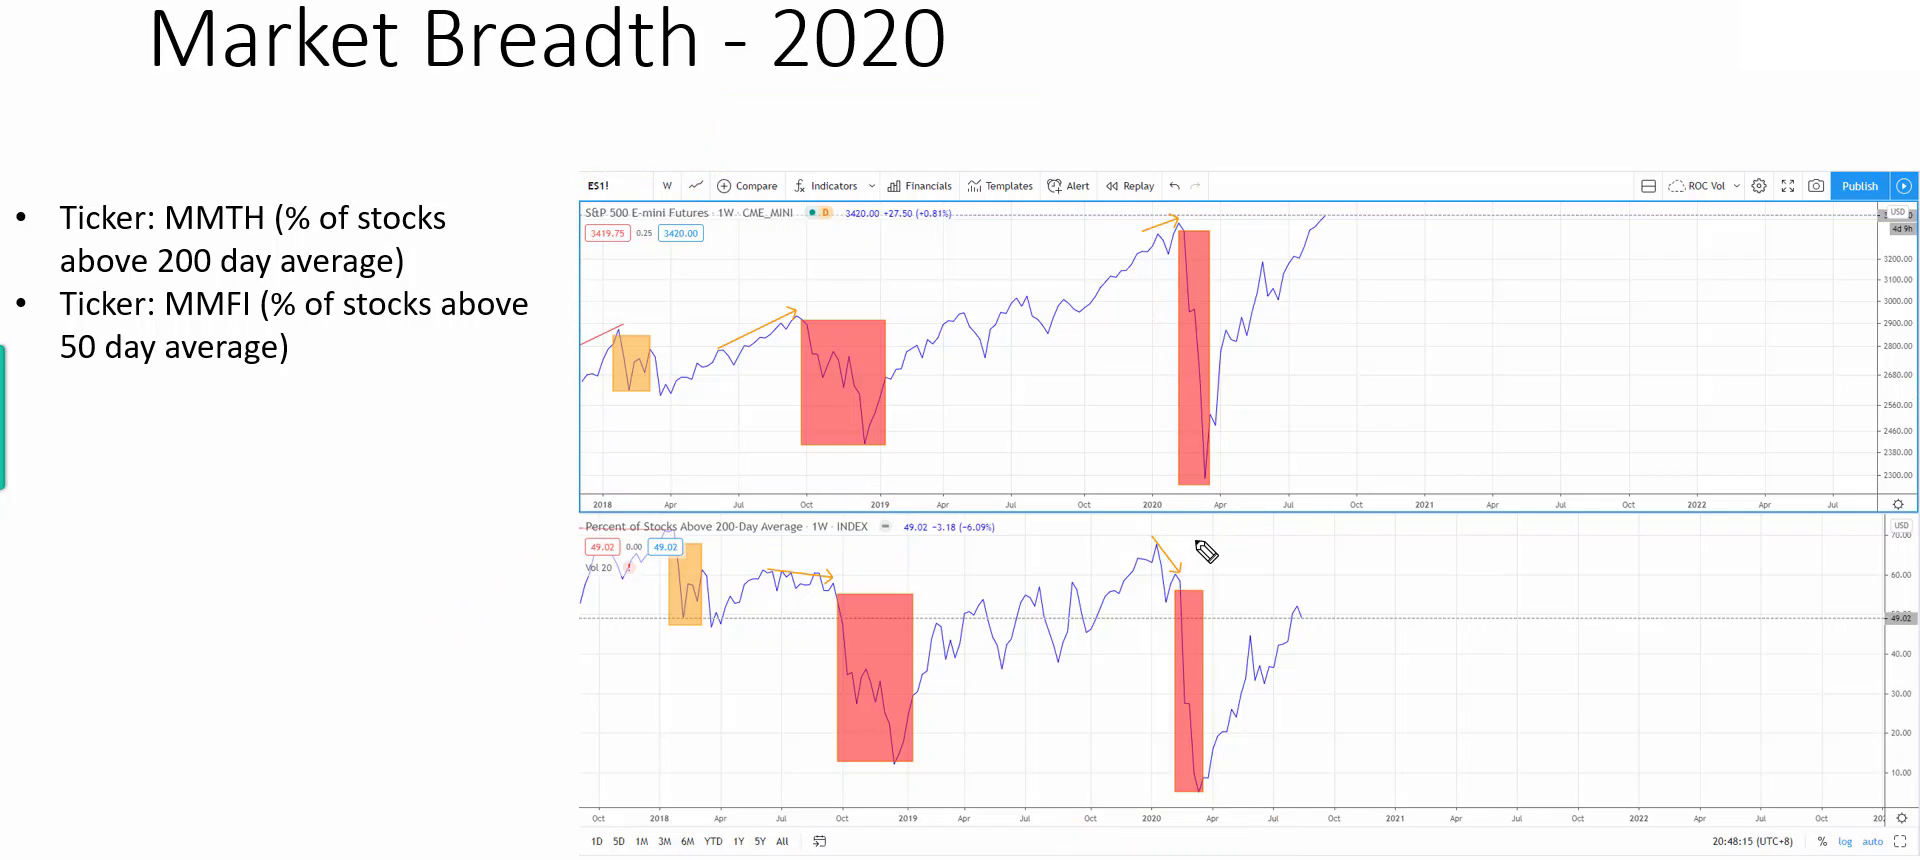
When the index makes a higher high and breadth makes a lower high, the new high is not confirmed. Fewer stocks are carrying it. The bull is getting tired.
That is the whole idea. The skill is reading it on a real chart without jumping to a conclusion, and that is what the video teaches.
What the 25 minutes covers
- Non-confirmation. Index higher high, breadth lower high, shown on early 2020. (at 1:31)
- Why it is an alert, not a forecast. (2:53)
- The confirmation. A sharp fall in breadth arriving with a change-of-character bar on the index. (6:17)
- The kickstart. What a sharp rise in breadth from under 20% has marked. (9:02)
- The index is not your stocks. Why an index can trend up with only 50-60% of stocks above the 200-day. (11:11)
- What can follow a change of character. Distribution or re-accumulation. (14:28)
- Five worked periods. 2020 (1:31), 2018 (4:35), 2015 (about 17:30), 2010-12 (20:03) and 2007-08 (22:43).
- The bullish mirror. Index lower low, breadth higher low, at the financial-crisis low. (24:13)
What it won't do
Breadth is not a timing signal, and I say so in the video. A divergence doesn't mean a sell-off is coming. Price action and context decide.
There are no stock picks, no setups and no system here. It is one tool, shown on real charts.
Who it's for
It suits you if you swing or position trade, already read charts, and want a way to judge the market behind your trades.
It is not for you if you want a signal that tells you when to buy or sell.
Price
Market Breadth Masterclass: $97 New subscribers: $47 with code P68N1UV at checkout.
If you later join Mastering Price Action Trading, the $47 comes off. Reply to any of my emails and I'll send the credit.
Digital product. All sales are final.